
Configuration of probes on an OVHcloud Load Balancer service
With the OVHcloud Load Balancer, you can distribute a front-end’s incoming traffic across a set of servers in a destination cluster.
There may be instances where a server in your cluster becomes unavailable for some reason, such as overload, an incident, or scheduled maintenance. When it encounters a connection error, your OVHcloud Load Balancer attempts to switch traffic to another server. The connection will be slower, but it will continue to function.
However, the causes of some unavailability are more subtle. For example, if a new version of code is being deployed, the application may temporarily be in a transitional state and return 500 errors. In this specific case, a solution would be to mark the affected servers as unavailable in the API before the start of the maintenance, apply the configuration and update, and then mark the servers as available again. This method is not ideal, but it works. For more information, please read our guide on deploying a blue-green architecture with an OVHcloud Load Balancer.
Probes are health checks. They periodically query each of your servers to ensure they are operational. If an error is detected, the server is automatically disabled until the situation is resolved.
Requirements
- Have an OVHcloud Load Balancer offer in your OVHcloud account (the service must be properly configured, with farms and servers set up)
- Be logged in to your OVHcloud Control Panel
Instructions
Table of contents
- Probe API overview
- Examples
- Reference
- From the OVHcloud Control Panel
Probe API overview
The probe API of your OVHcloud Load Balancer has been designed to be flexible and scalable.
Probes are configured directly on the server clusters. All servers in the same cluster thus apply the same probe. However, enabling or disabling a probe is specific to each server. It is therefore possible to "monitor" only certain servers in the same farm.
The list of available probes and their parameters can be consulted with the API call:
For more information on this call, please read the Available probes section at the bottom of this guide.
The probes in this list can be configured on http and tcp clusters (farms) via the following calls:
For more information on these calls, please read the Probe handling section at the bottom of this guide.
Examples
Check if the server accepts TCP connections
This is the simplest method to set up. It is compatible with tcp and http cluster. If no other probes are configured, you can activate it to start. It works by periodically attempting to open a connection on each of your servers. If the connection fails twice in a row, the server is put aside until it responds again.
In practice, this gives a probe:
All other probe fields can keep their default values. Just apply the configuration to the zone concerned, and the probe will begin to work.
Test a specific HTTP page
By default, the HTTP probe sends an OPTIONS request on / in HTTP/1.0, without a domain name. In many cases, this is sufficient, but some servers do not manage this method. You can carry out much more powerful tests with the HTTP probe. For example, a good practice when exposing an HTTP service is to add a router dedicated to probes. It is normal to see /status, /health, and /check, which summarize the service’s status.
In practice, if you want to configure the probe to send a GET request on http://api.example.com/status, it gives:
All other probe fields can keep their default values. Finally, apply the configuration to the zone concerned.
Use an external HTTP test
What if your service is, for example, an IMAP server that relies on an LDAP server for authentication?
It is possible that the server accepts connections, but has a temporary connection issue with the LDAP server. If this happens, clients who are directed to this server could connect but not authenticate. The server should therefore be removed from the farm.
If a tcp type probe is used, it will be able to connect and consider the service available even though it is not the case.
In this scenario, the ideal would be for the health check to confirm that the base service is working. It is possible to indicate a specific port to use in the tests. This allows arbitrary tests to be set up for a service and exposed in HTTP, on a dedicated port.
For example, in this scenario, it would be possible to have an HTTP server on port 8080 that tests the IMAP server via the URL /service/imap/status and returns OK when everything is fine. This would give in practice:
Just apply the configuration to the zone concerned, and the probe will begin to work.
NOTE: If the HTTP service dedicated to monitoring your IMAP service experiences a fault, the IMAP service will also be considered as failed, even if it is in perfect working condition.
Reference
Probe configuration
Configure a probe
Probes can be configured on a new cluster (POST) or an existing one (PUT). Since the two methods are equivalent, only the second (PUT) method is presented here.
Service:
Parameters:
serviceName: Your OVHcloud Load Balancer ID.
farmId: Your
clusterID number.probe
type
- The type of
probeto activate. The probe types managed are:tcpfor a basic TCP connection test.httpfor an HTTP connection test. You can specify the URL and the method.smtpfor a basic SMTP connection test.mysqlfor a basic MySQL connection test.pgsqlfor a basic PostgreSQL connection test.ocofor a confirmation of the general status returned on port 79.interval: The interval (in seconds) between a probe’s two connection attempts. It must be at least 30 seconds.
port: The port that the probe must use if it is different from the port configured on the cluster. This enables you to delegate a server’s status validation to a separate service on the machine, and carry out arbitrary probes.
method: The HTTP method to use if the probe is an “http” probe. Compatible methods are
GET,HEAD, andOPTIONS(by default).url: The URL to use for tests, if it is an “http” probe type. It should be formulated as follows:
[[https?://]www.example.com]/path/to/check. If a domain is specified, its request will be sent to HTTP/1.1 rather than HTTP/1.0 by default.match: The type of comparison to use to check if the server is in good health. The managed comparison types are
default,status,contains, andmatches. Comparison types are compatible with both “http” and “tcp” probes.pattern: The value to use as an argument of the comparison type if it is different from “default”.
forceSsl: This defines whether the probe must work in SSL/TLS, even if the cluster is configured to connect via standard TCP. This can be useful when, for example, your OVHcloud Load Balancer is configured to monitor HTTPS traffic in TCP without decrypting it.
Other parameters can be edited via this call. Since this guide focuses on probes, they are not documented here.
If a port other than the cluster's base port is configured on the probe, the proxyprotocol and ssl settings are reset. As an example, we will take a configured cluster to use proxyprotocol on port 4242, and an associated probe using port 8080. The probe will not send the proxyprotocol header when it connects on port 8080. The same goes for ssl, but it can be forced.
NOTE: When a probe is configured on a cluster, it must be activated on the servers.
Enable probes on a server
For a probe to be active, it must be configured on the cluster and enabled on the relevant servers. With this call, you can enable the probe:
Service:
Parameters:
serviceName: Your OVHcloud Load Balancer ID.
farmId: Your
clusterID number.serverId: Your
server’sID number.probe: Whether or not the
probesmust be taken into account.
Other parameters can be edited via this call. Since this guide focuses on probes, they are not documented here.
Available comparison types
Four comparison types are available to confirm a probe’s results:
The contains and matches comparators look for a match in the first 16 KB of the response. If it is longer, the part beyond will be ignored during the search. Note that for better performance, we recommend returning as little information as possible in your probes.
Available probes
You can get a list of the available probes using the following API call:
Service:
Response:
type: The type of
probeto configure in theprobe.typeofclusters.
tcpfor a basic TCP connection test.httpfor an HTTP connection test. You can specify the URL and the method.smtpfor a basic SMTP connection test.mysqlfor a basic MySQL connection test.pgsqlfor a basic PostgreSQL connection test.ocofor a confirmation of the general status returned on port 79.port: This defines whether the port can be configured for this probe.
method: The list of HTTP methods managed, or
nullif none are managed.url: Indicated whether the probe’s URL can be configured.
matches: The list of comparison types available for this probe. The interpretation of the
probe.patternfield depends on this field. The comparison types potentially managed are:
default: The simplest test, without any particular conditions.probe.patternmust be empty.status: Checks if the HTTP status code is in the list, separated by commas.contains: Checks that the server response containsprobe.pattern.matches: Checks that the server response matchesprobe.pattern.
TCP
This probe attempts to establish a TCP connection to the server. If the server sends a “banner," you can check if it matches a schema. The default test simply ensures that the connection can be established.
HTTP
This probe attempts to establish an HTTP connection to the server. If the server responds, you can check its HTTP status code and that the response body matches a schema. The default test sends an OPTIONS request to the '/' page in HTTP/1.0, without a Host field.
If the URL is specified, the domain name and protocol are operational. If a domain name is specified, the “Host” field of the request will be filled in, and the request will be sent to HTTP/1.1. If the protocol is specified, it must be consistent with the cluster's SSL configuration.
We recommend configuring the method (at least) with GET. Some servers, including NGINX, do not manage the OPTIONS method without prior configuration.
SMTP
This probe attempts to establish an SMTP connection with the server and sends the "HELLO localhost" command. If the latter responds, the probe checks that the return code starts with a "2" (success). This probe has no specific configuration options.
MySQL
This probe attempts to establish a MySQL connection with the server and analyzes the server's response. This probe has no specific configuration options.
PostgreSQL
This probe attempts to establish a PostgreSQL connection with the server and analyzes the server’s response. This probe does not have any specific configuration options.
oco
This probe attempts to establish a TCP connection on port 79 of your server and checks that the response starts with a "2" (success). This probe does not have any specific configuration options.
Via the OVHcloud Control Panel
From the OVHcloud Control Panel, you can configure probes when you add or modify a server cluster, in the Advanced settings.
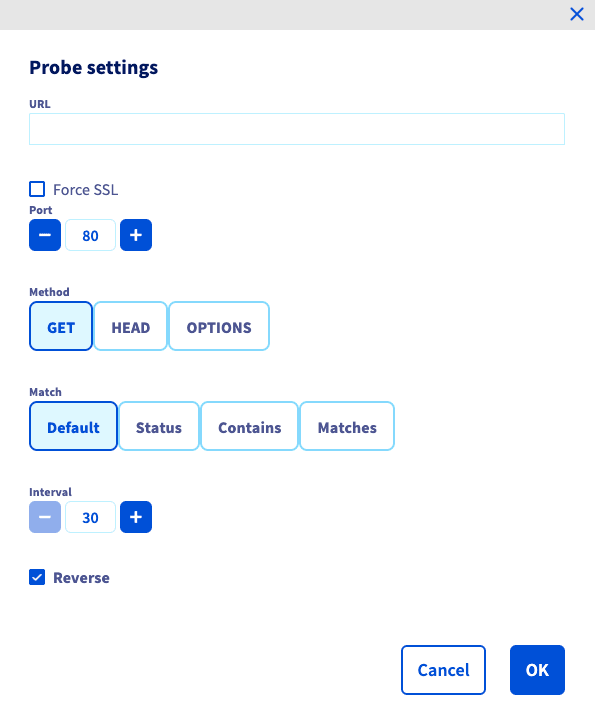
If the probe type you have selected allows it, you can configure advanced settings that are specific to that probe.
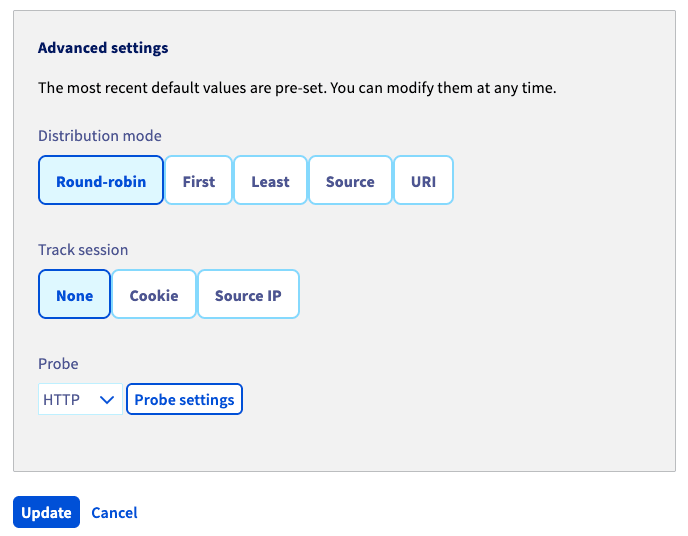
A new configuration window will appear, with the probe’s settings.
Go further
Browse all the Load Balancer guides.
Browse the rest of the OVHcloud US documentation for guides on our other products and services.
Learn more about Load Balancer on the OVHcloud US website.