
Dashboards - Tutorial: Expose your Dashboards instance in your private network via a reverse proxy NGINX
Learn how to expose your managed Dashboards to the internet through the configuration of an NGINX instance in reverse proxy mode.
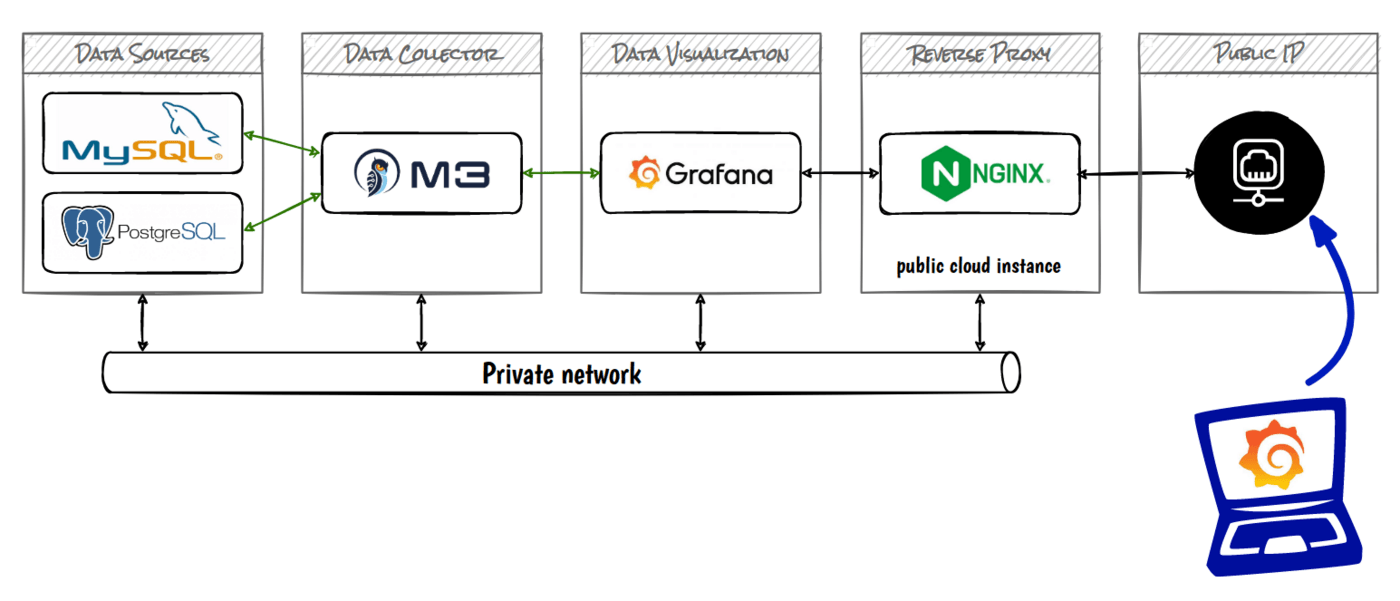
Cloud Analytics can be deployed over a public network (internet) or private network. When using a private network, you don't have access by default to monitoring tools we provide as a service, like Cloud Analytics with Dashboards (metrics) or OpenSearch™ (logs).
Schema concept:
NOTE: OVHcloud provides services for which you are responsible for their configuration and management. You are therefore responsible for their proper functioning.
This tutorial is designed to help you as much as possible with common tasks. If you are having difficulty performing these actions, please contact a specialized service provider. OVHcloud cannot provide you with technical support in this regard.
Requirements
- A Public Cloud project in your OVHcloud account
- Access to the OVHcloud Control Panel
- A Dashboards service running on your OVHcloud Public Cloud project (this guide can help you meet this requirement)
If you need more details on the private network configuration, use this guide.
Instructions
Create a new instance in your vRack
This guide can help you create a new instance in your vRack.
For this tutorial, we will use an Ubuntu 22.10 image to install NGINX.
Log in to your OVHcloud Control Panel and create a new compute instance in your vRack. If you need to expose your Reverse Proxy to a public network, please select the IP Floating address option.
Install NGINX
Once you have access to your new instance, update your system and install NGINX:
Check if your NGINX service is installed and running correctly:
Configure NGINX
Regarding the NGINX configuration, we are going to follow the official Grafana® documentation.
Create a configuration file in the /etc/nginx/sites-enabled/ file:
Be careful, replace the hostname of the Grafana® server your-grafana-12345abc-12345abc.database.cloud.ovh.us:443 with your own.
Also, update the certificates and SSL key. If necessary, you can create them for testing purposes or in a non-productive environment using the following commands:
Finally, reload NGINX.
Now the NGINX is configured in reverse proxy mode.
IP Packet forwarding
To redirect traffic from your Public IP to your Private IP, uncomment the following line in /etc/sysctl.conf to enable packet forwarding for IPv4:
Then force the system to reload the kernel variables:
Connect to your managed Dashboards
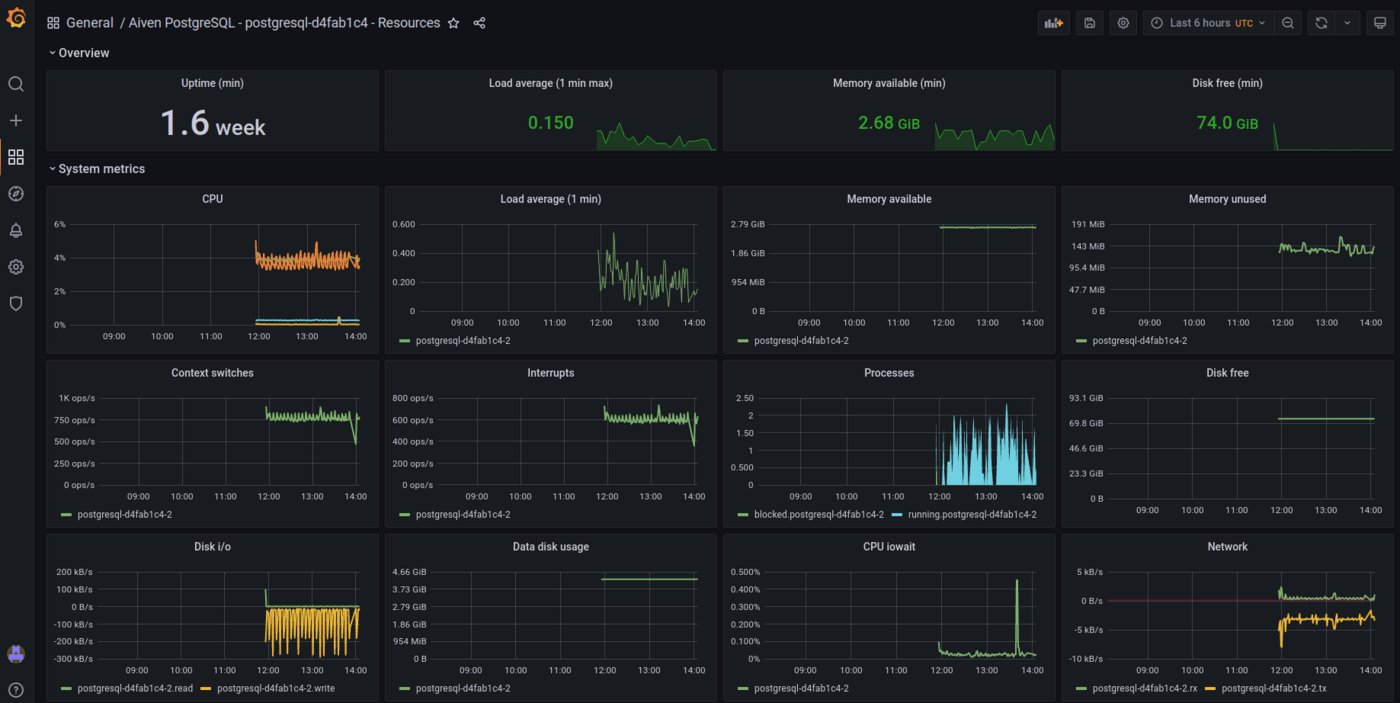
Connect to your https reverse proxy server with your browser (accept the SSL certificate if needed). You now have access to your predefined or customized dashboards.
Go further
Browse all the Analytics guides.
Browse the rest of the OVHcloud US documentation for guides on our other products and services.
Learn more about Cloud Analytics on the OVHcloud US website.
OVHcloud Managed Databases and Analytics:
- Grafana® is a registered trademark of Grafana Labs and is used with the permission of Grafana Labs. OVH SAS and its subsidiaries are not affiliated with or endorsed by Grafana Labs.
- Kafka® is a registered trademark of The Apache Software Foundation and has been licensed for use by OVHcloud, who has no affiliation with and is not endorsed by The Apache Software Foundation.
- MongoDB® is a registered trademark of MongoDB, Inc.
- MySQL® is a registered trademark of Oracle and/or its affiliates.
- PostgreSQL® is a registered trademark of the PostgreSQL Community Association of Canada.