
OpenSearch™ - Monitor your infra (with Logstash or Fluent Bit)
Learn how to configure two famous collectors, Logstash and Fluent Bit, to connect and forward data logs to your Cloud Analytics with OpenSearch™ service.
OpenSearch™ is an open-source search and analytics suite. Several methods are available to push relevant data to OpenSearch™. You can upload a file easily, but for real-time data such as metrics and logs, collectors are required.
Requirements
This tutorial requires:
-
Access to the OVHcloud Control Panel
-
A Public Cloud project in your OVHcloud account, running at least:
- one Cloud Analytics with OpenSearch™ service running;
- one or more additional compute instances running Linux, acting as a data injector. It can also be your computer, a Kubernetes cluster, etc.
NOTE: Make sure that you have a user account with enough privileges to write to the OpenSearch™ service, and that the IP addresses that you will use to run your agents (Logstash and Fluent Bit) are part of the authorized list. Check our Getting started guide for more information.
Software environment
The main software components used to create this tutorial are:
-
OpenSearch™ 1.0 Public Cloud DB instance
-
Linux Ubuntu 21.10 / Apache2 2.4.48 to run:
- Logstash 7.13.2
- Fluent Bit 1.8
OpenSearch™ Agents and ingestion tools compatibility Matrix
Due to the fork from ElasticSearch, it is recommended to verify the software version that you will use: OpenSearch™ Compatibility Matrices.
Instructions
Step 1: Logstash as the data log source
Install Logstash on client sources
To collect data, you need to install the collector agent on the data source. In our case, it's a Linux Ubuntu virtual machine, but it can be anything.
Please refer to the official OpenSearch™ Logstash installation documentation.
As detailed in the compatibility matrix, select and download a compatible release from ElasticSearch. Click here to download Logstash OSS past releases.
Configure Logstash
The default configuration is sufficient for this tutorial, but in case you need to review the configuration, go to /etc/logstash and look at the configuration files (logstash.yml).
Configure a pipeline
Every pipeline is based on three phases: inputs, filters, and outputs. For this tutorial, let's assume an Apache service is running. We will collect Apache access logs to configure a pipeline with:
- the Apache access.log file as the input;
- the filter is based on the predefined grok;
- the OpenSearch™ instance as the target output (modified with your values).
Configuration file: /etc/logstash/conf.d/apache2.conf
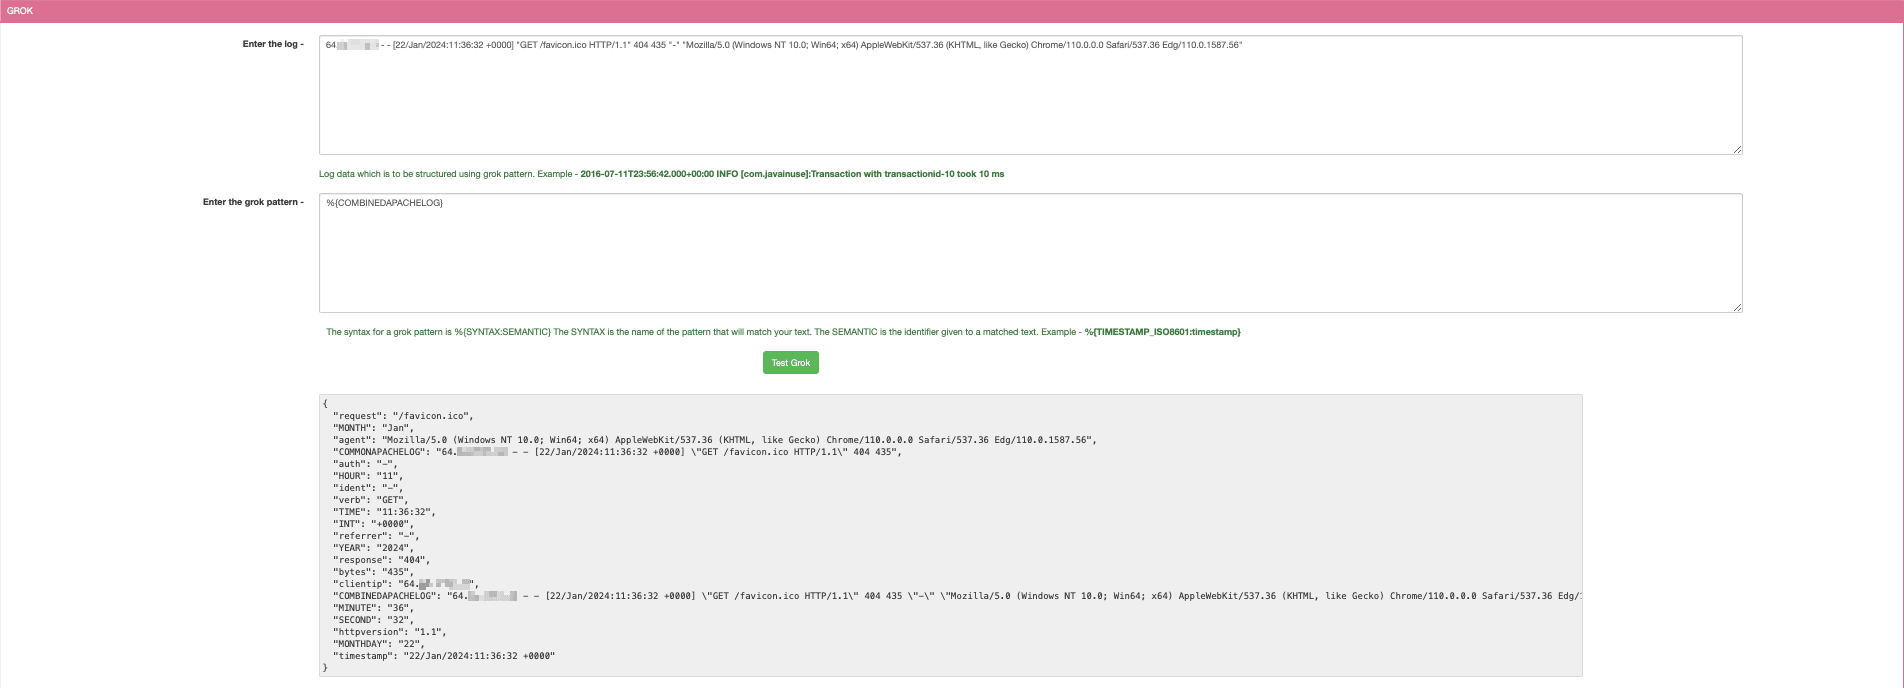
Grok patterns and debugger
As an example of the main pattern matching that is currently used, or to test some more specific ones, you can use some tools like Javainuse Grok Debugger:
Step 2: Visualize Logstash data in the OpenSearch™ Dashboard
Validate that the index has been created and is now populated
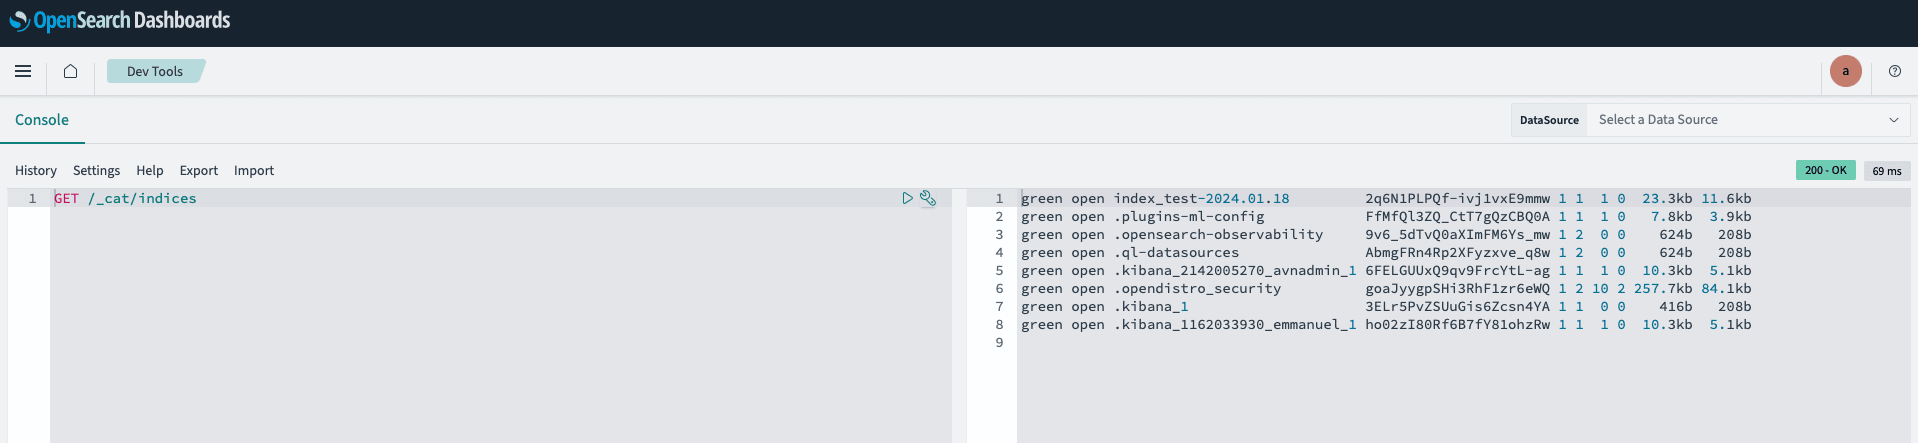
Now that we have Logstash running and parsing the Apache access log file, let's do a different connection to the Apache service and validate that Logstash is forwarding all access data to OpenSearch™. Let's also connect to the OpenSearch™ Dashboard to check that the corresponding index has been created and that some first documents have been populated.
Use the Dev Tools to query the indices:
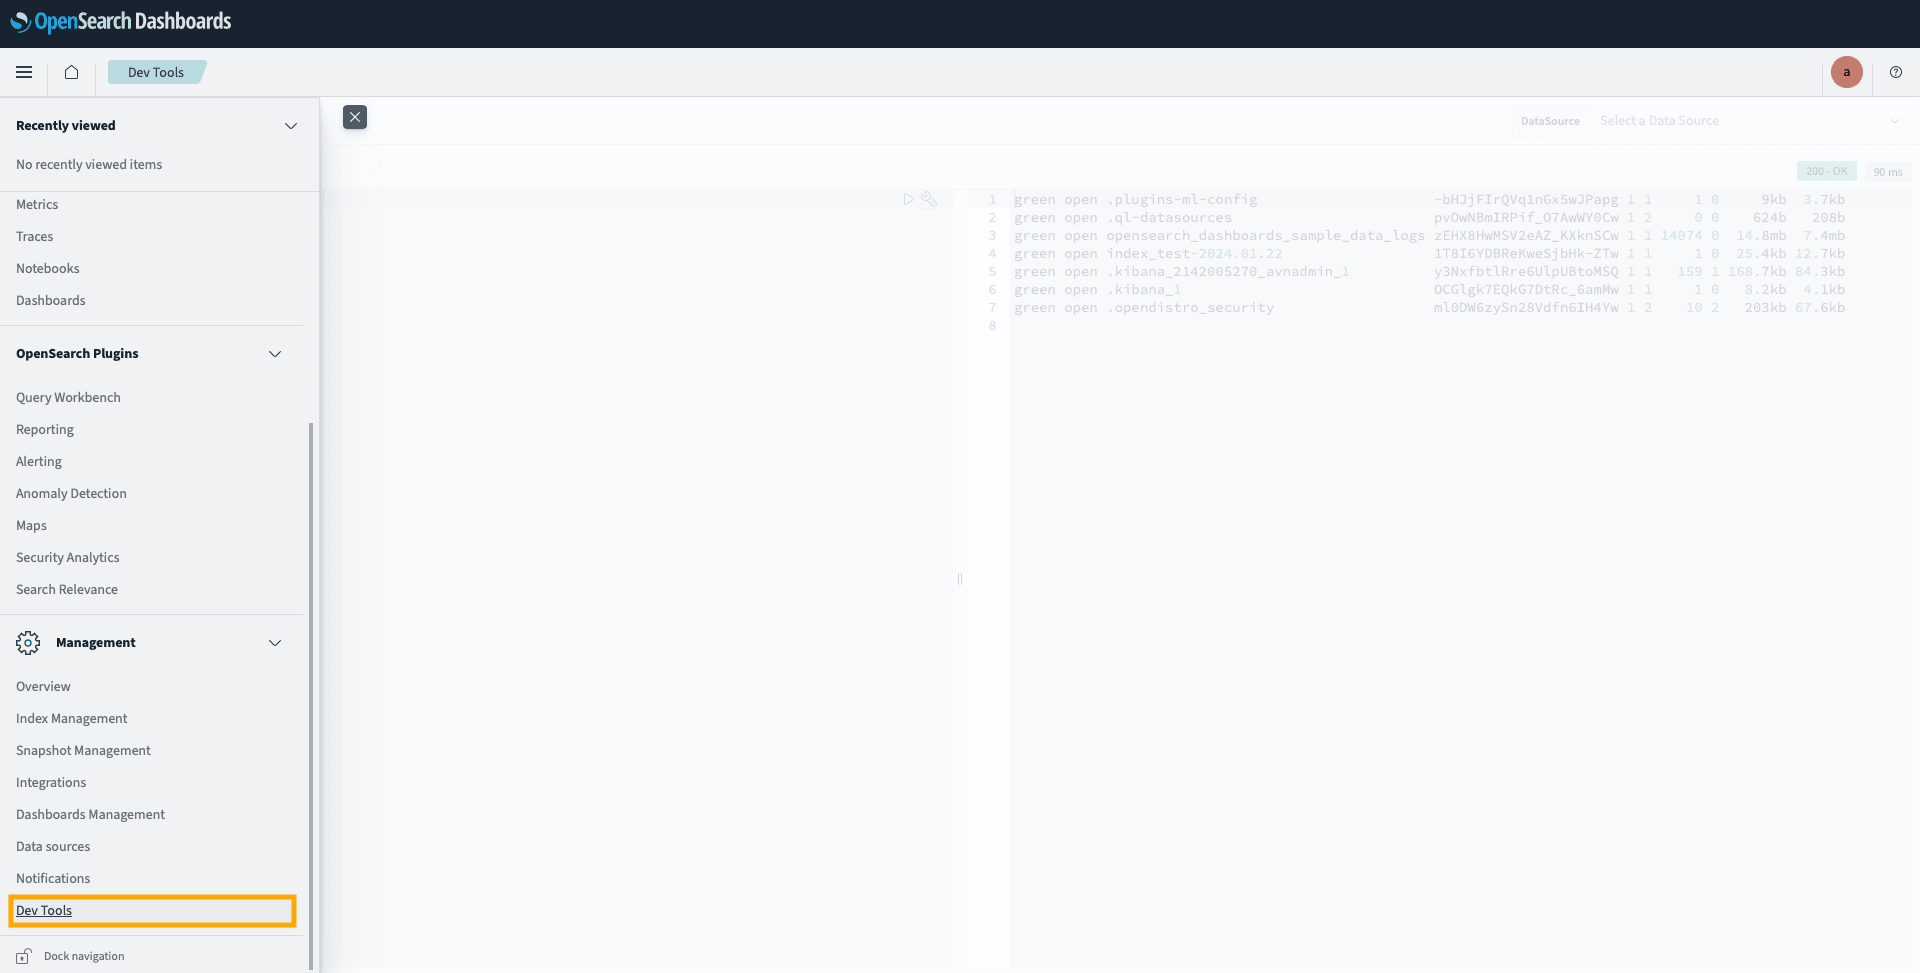
Then, in the console, execute a GET /_cat/indices command to get the index list with the number of documents for each:
Create an index pattern
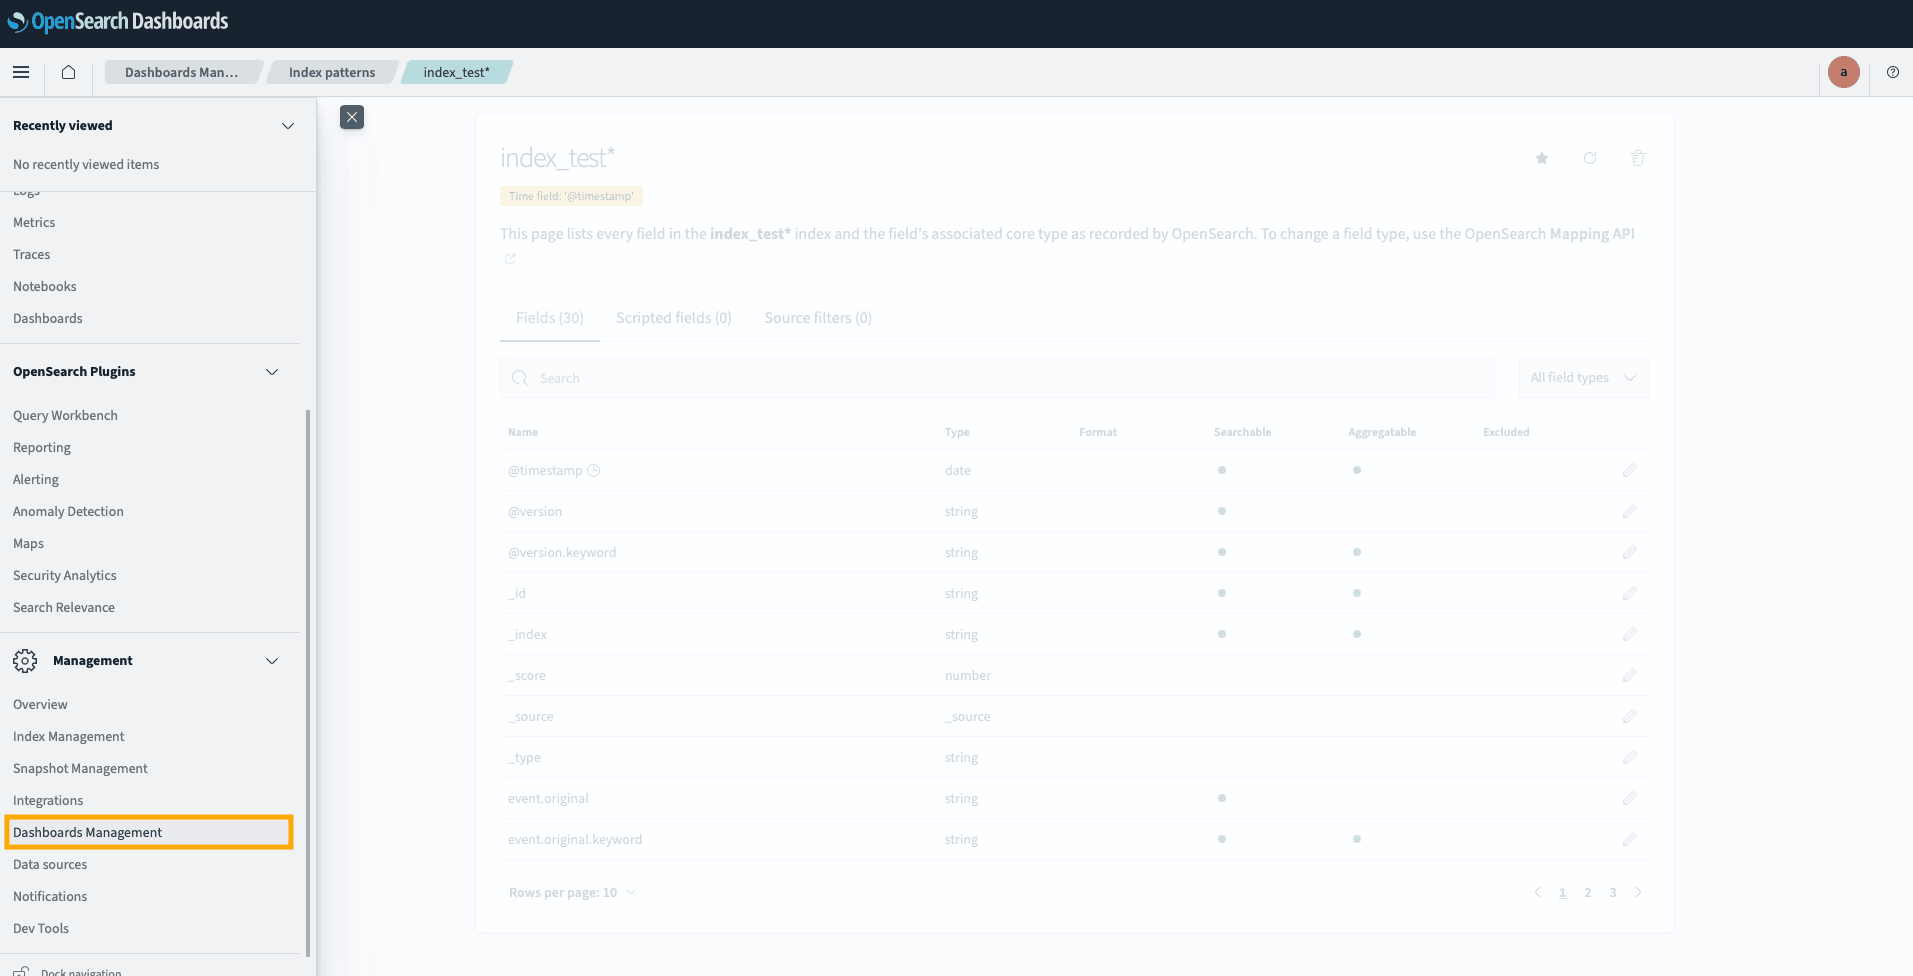
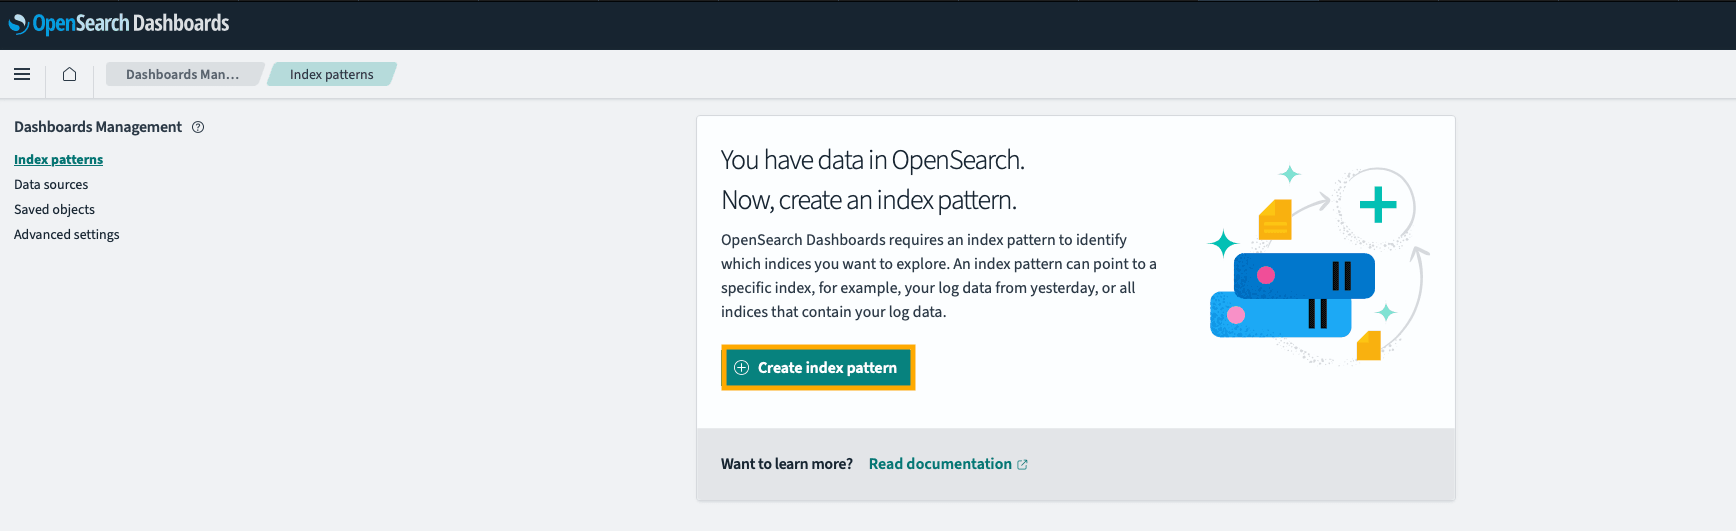
To aggregate all corresponding daily indices, we have to create an index pattern from the Dashboard Management menu:
Click + Create index pattern.
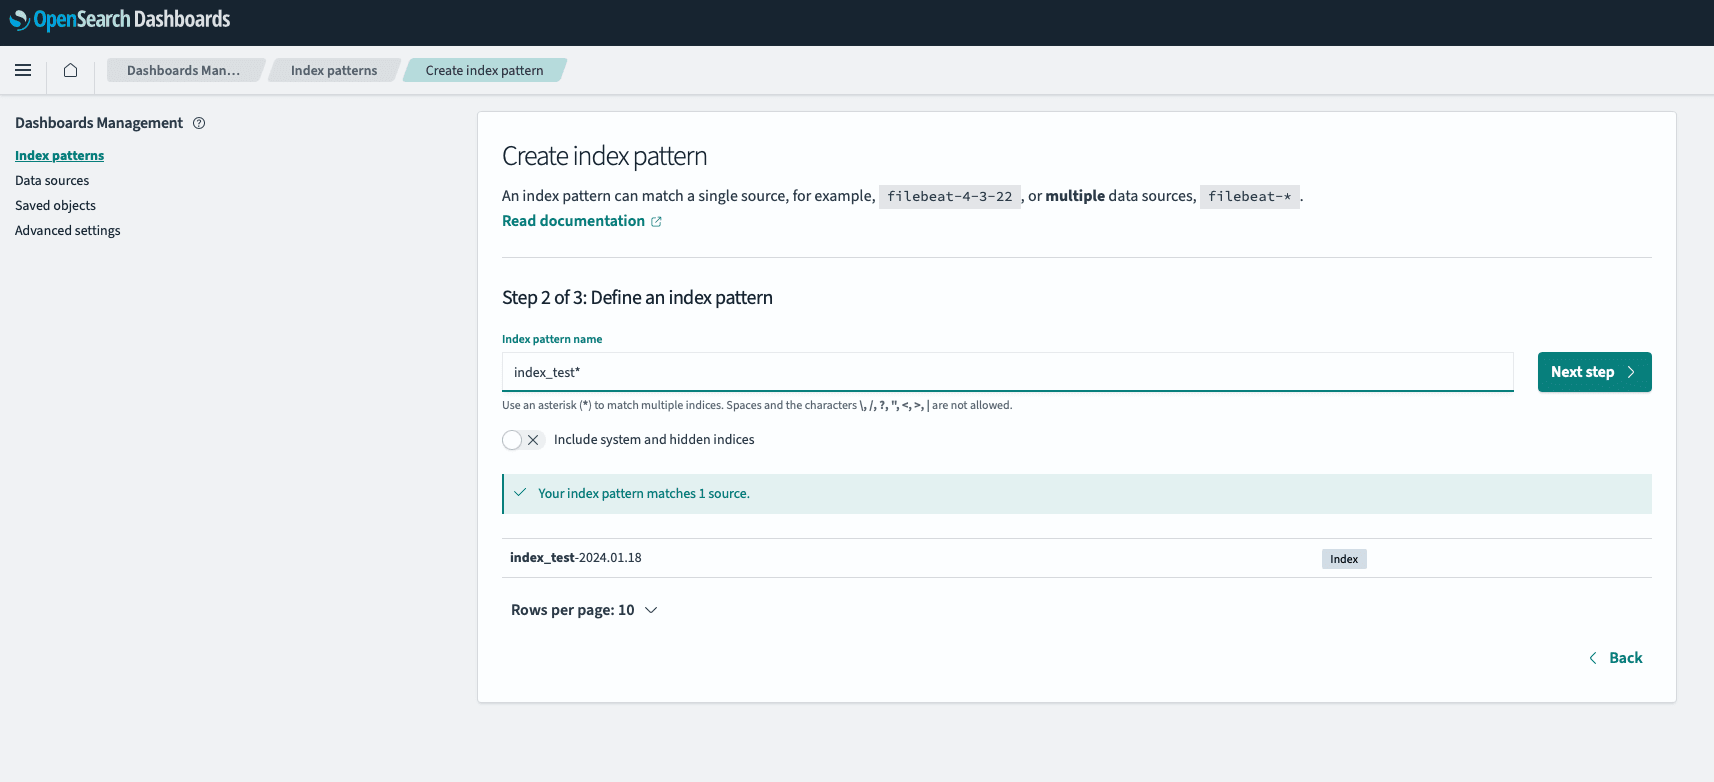
As we want to consolidate all our daily indices, let's define the pattern as index_test:
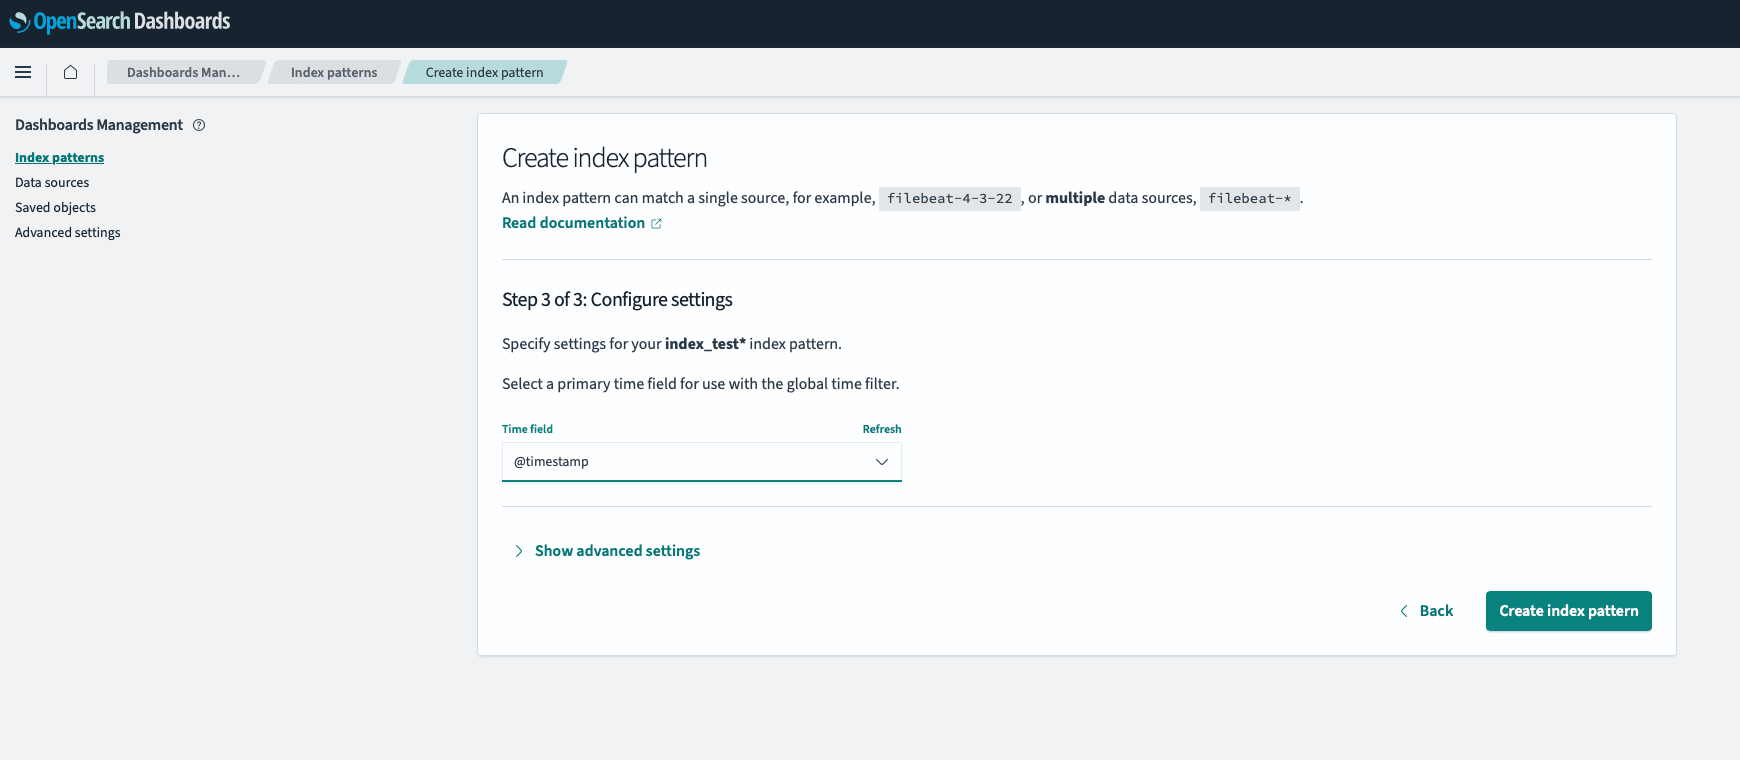
Then define the timestamp:
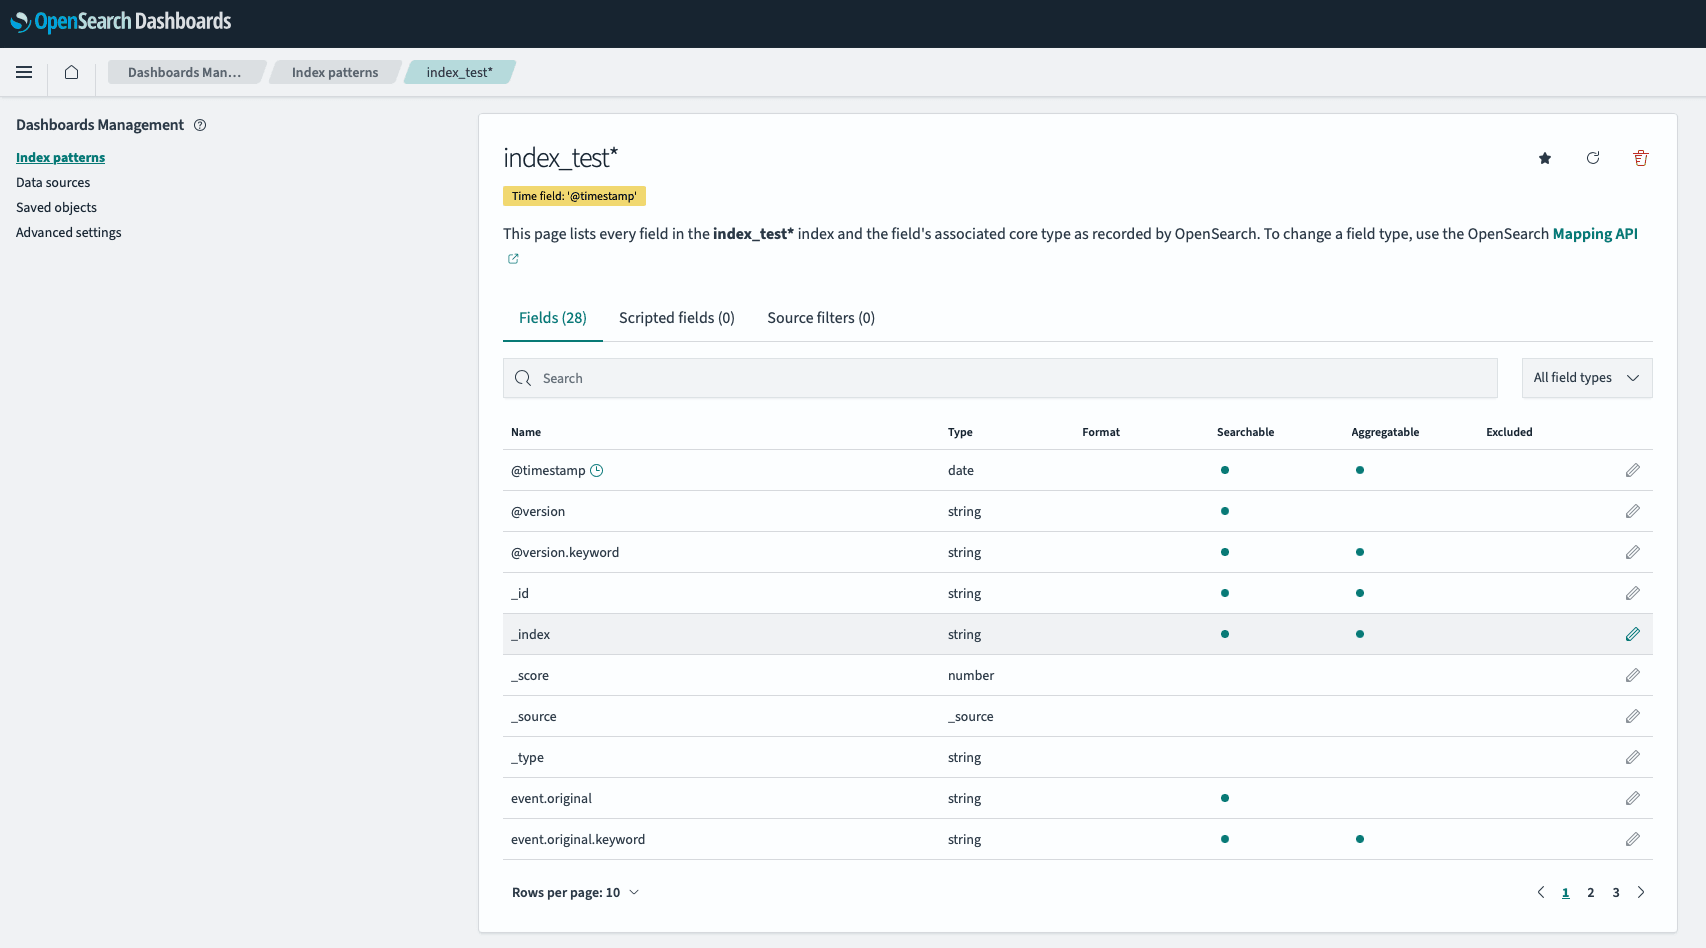
OpenSearch™ will then define all fields available and their type directly from stored documents in the index:
Create a new dashboard
Create a new visualization
In the OpenSearch™ Dashboard, click Visualize, then + Create new visualization.
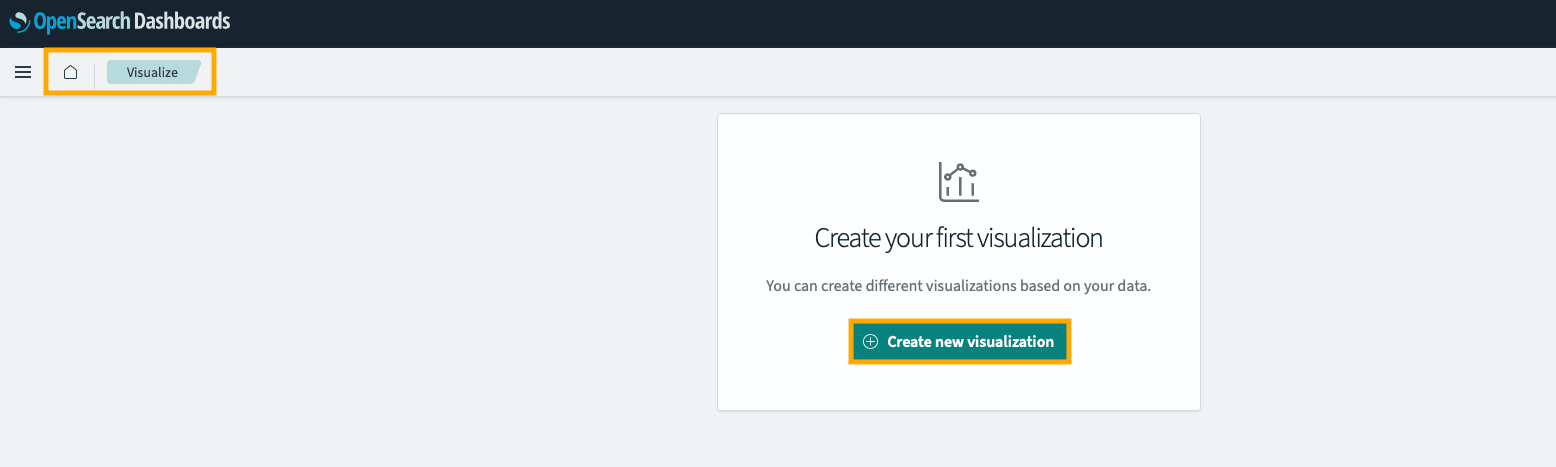
Select the visualization type:
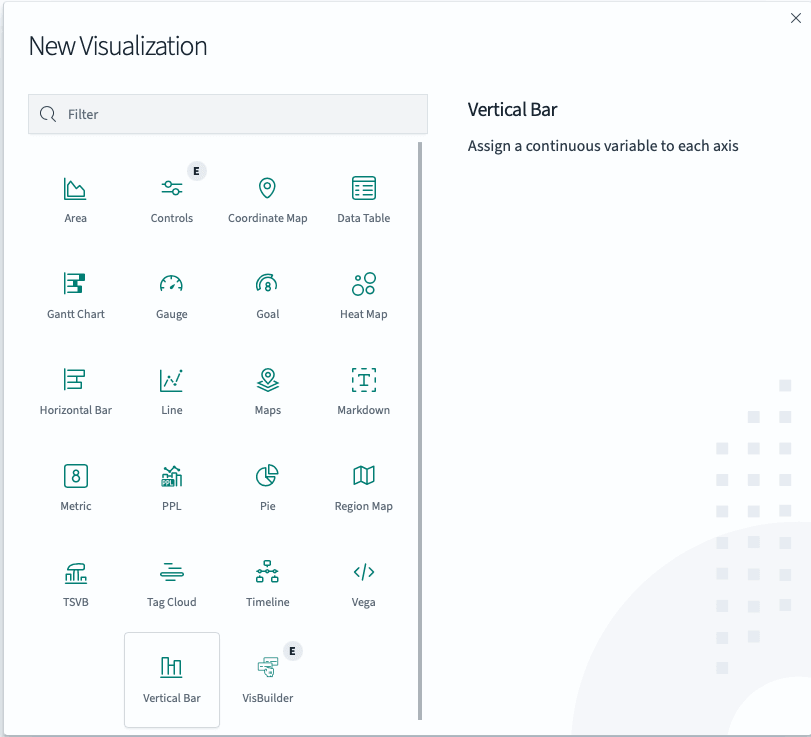
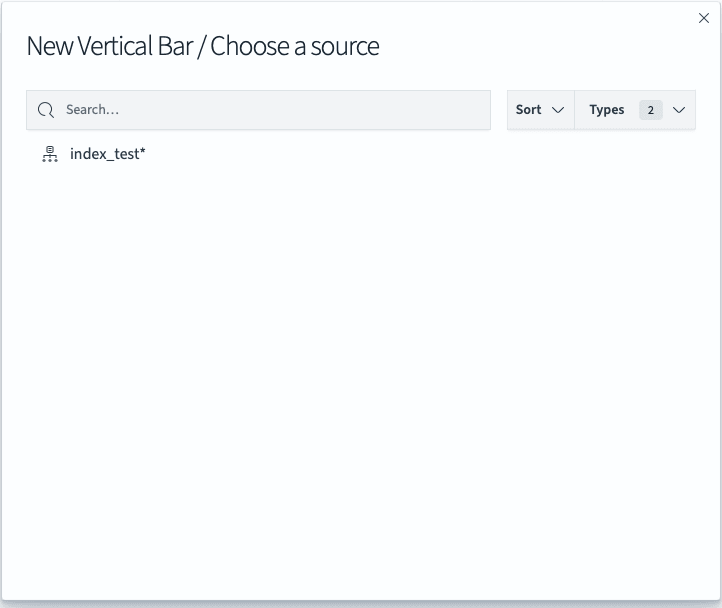
Then select the data source (the index pattern you just created):
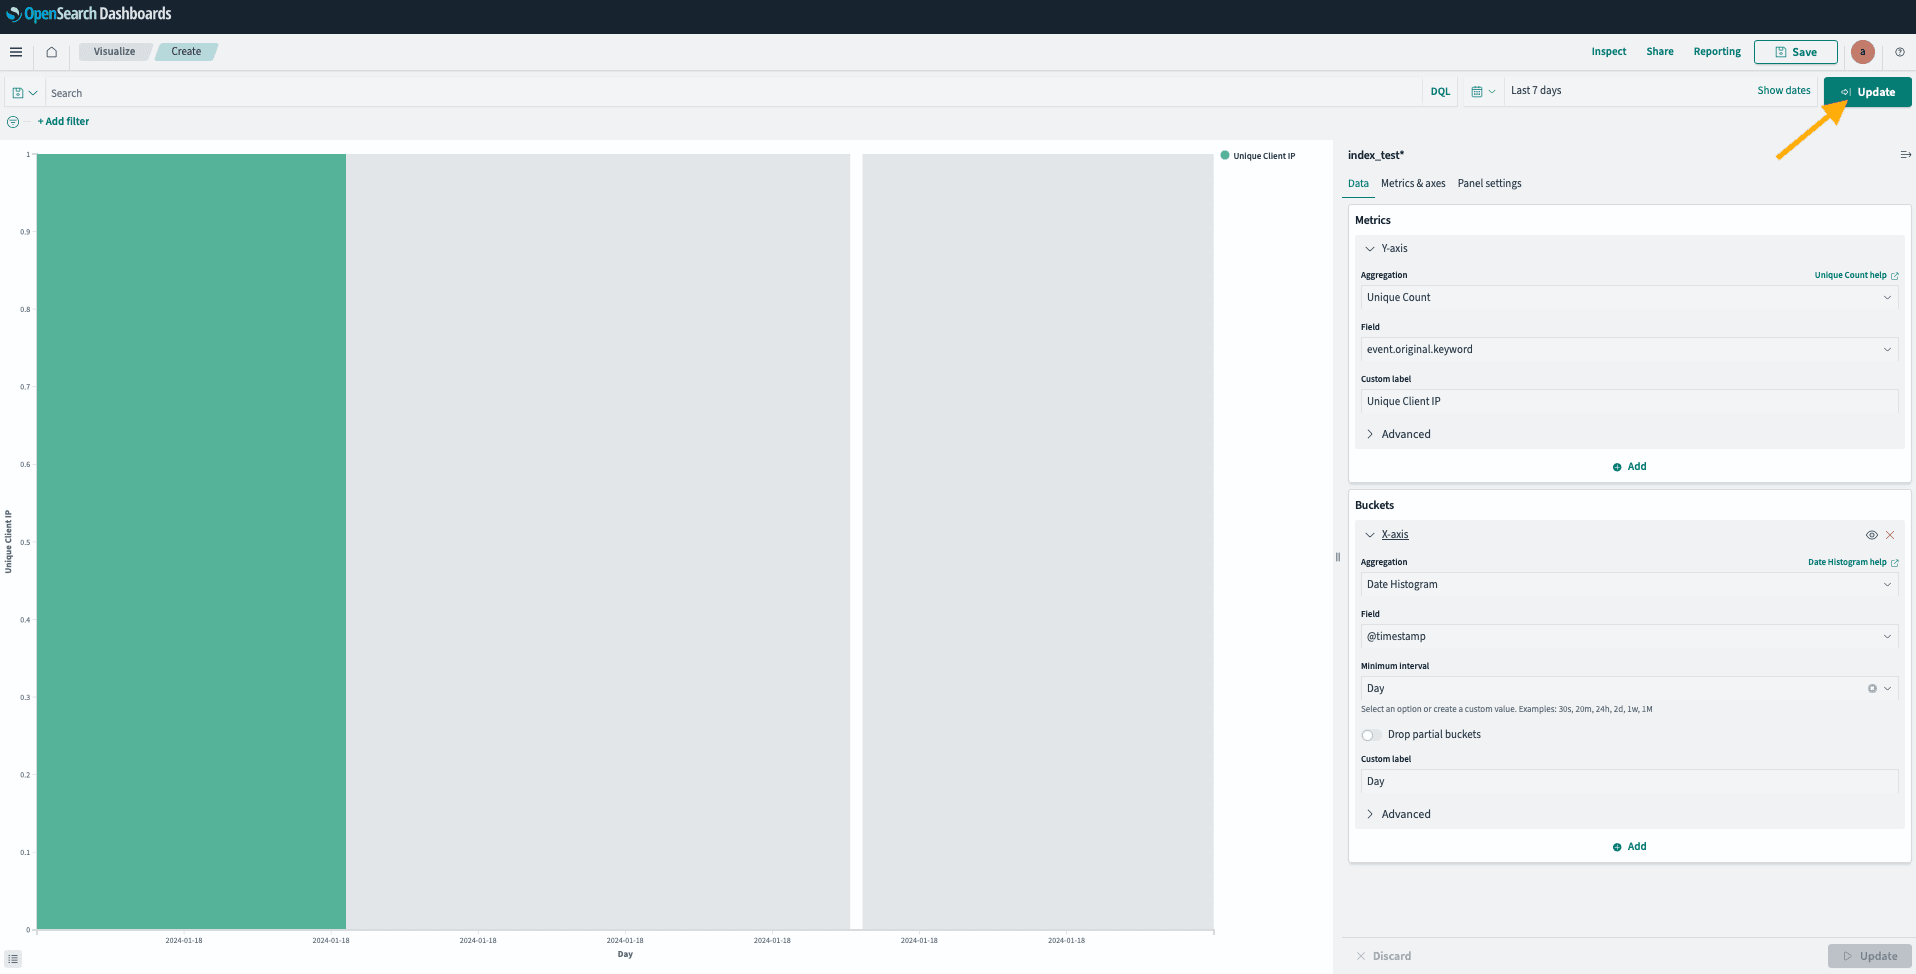
You now have to define all the criteria that you need to visualize:
- the period (last 7 days in our example);
- for the metrics, the Y-axis data (aggregation/field);
- and the same for Buckets with time intervals in case of data aggregation.
Click Update after making changes to the data definition, or refresh if you change the data time scale.
Save your visualization:
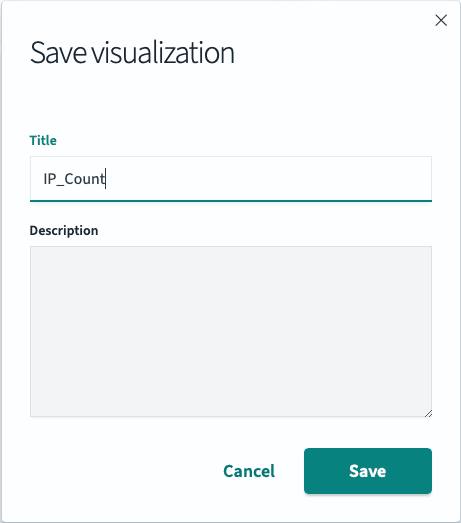
Add visualizations to a dashboard
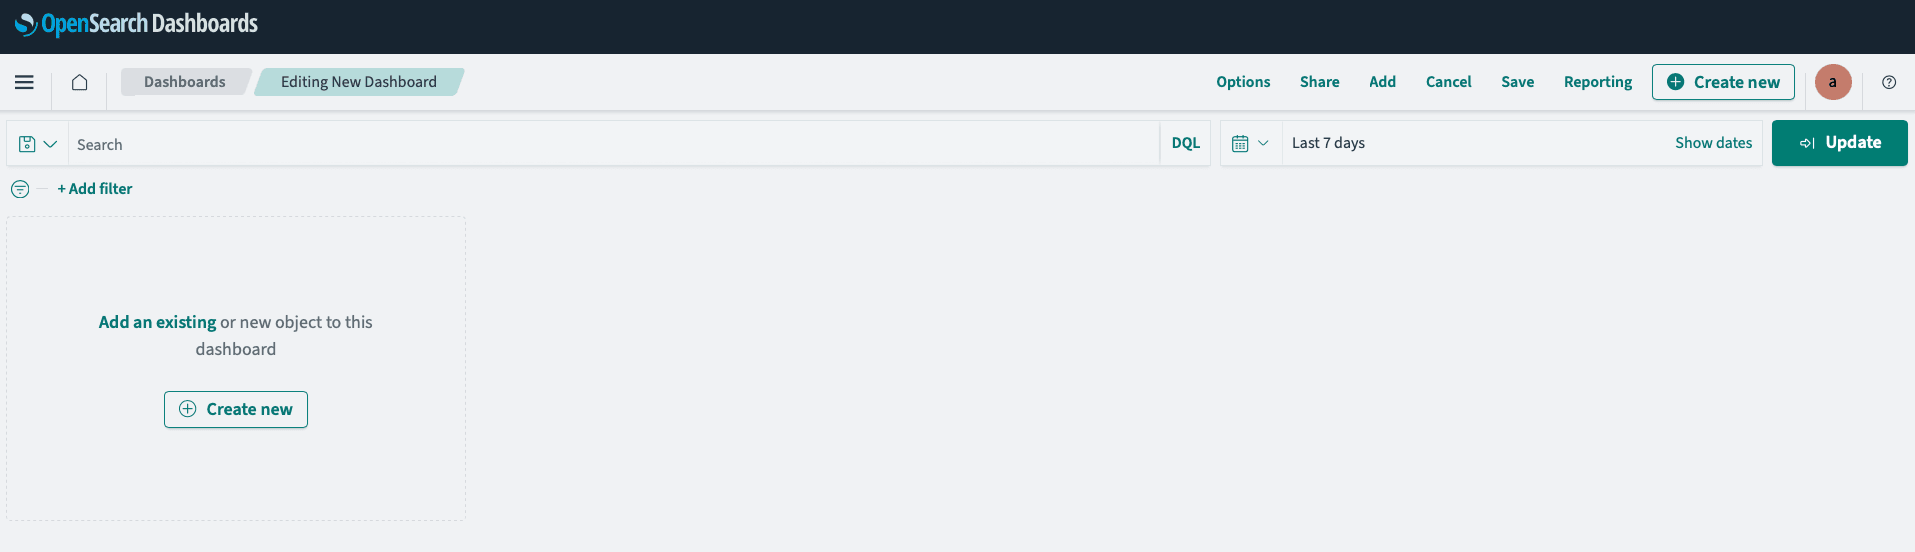
Let's make a dashboard with the visualization you've just saved.
Create a new dashboard:

As we have already created a visualization, Add an existing object:
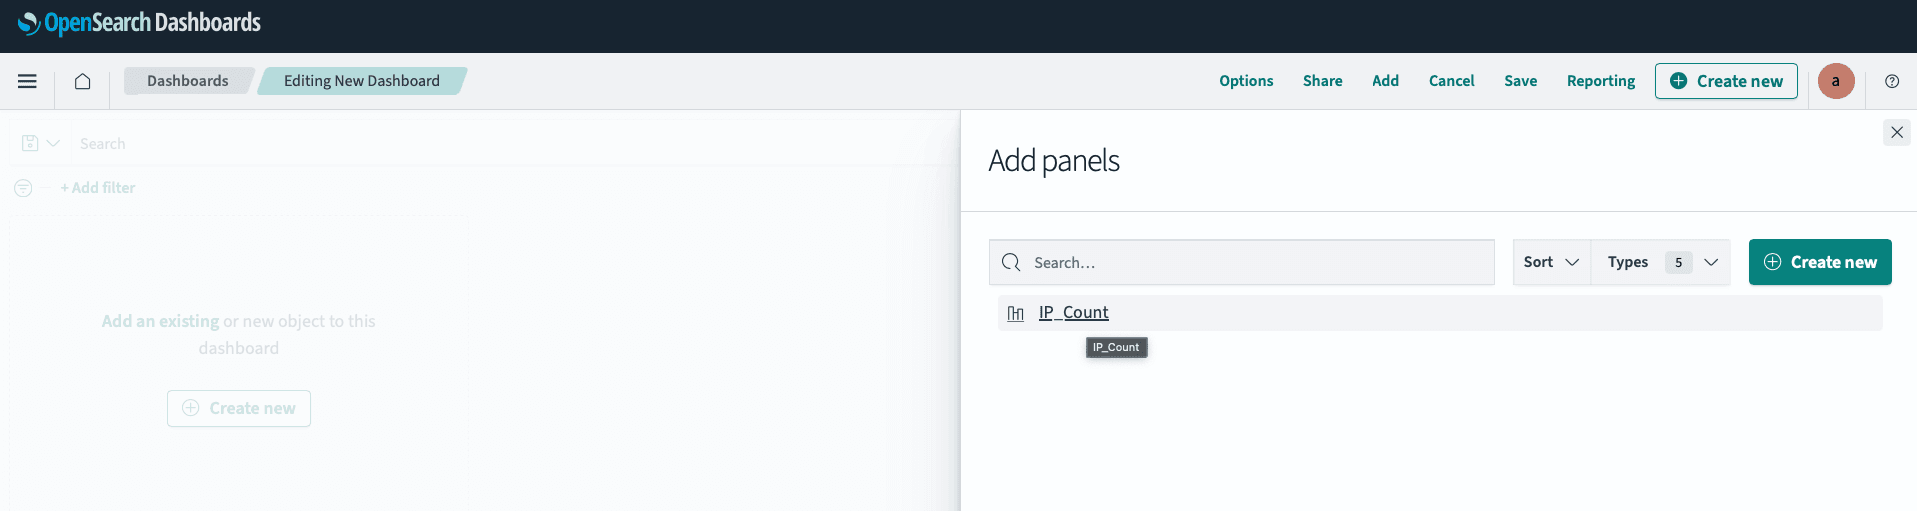
Search and select the one we just created:
Reorganize your panels, and add new or existing ones as wanted:
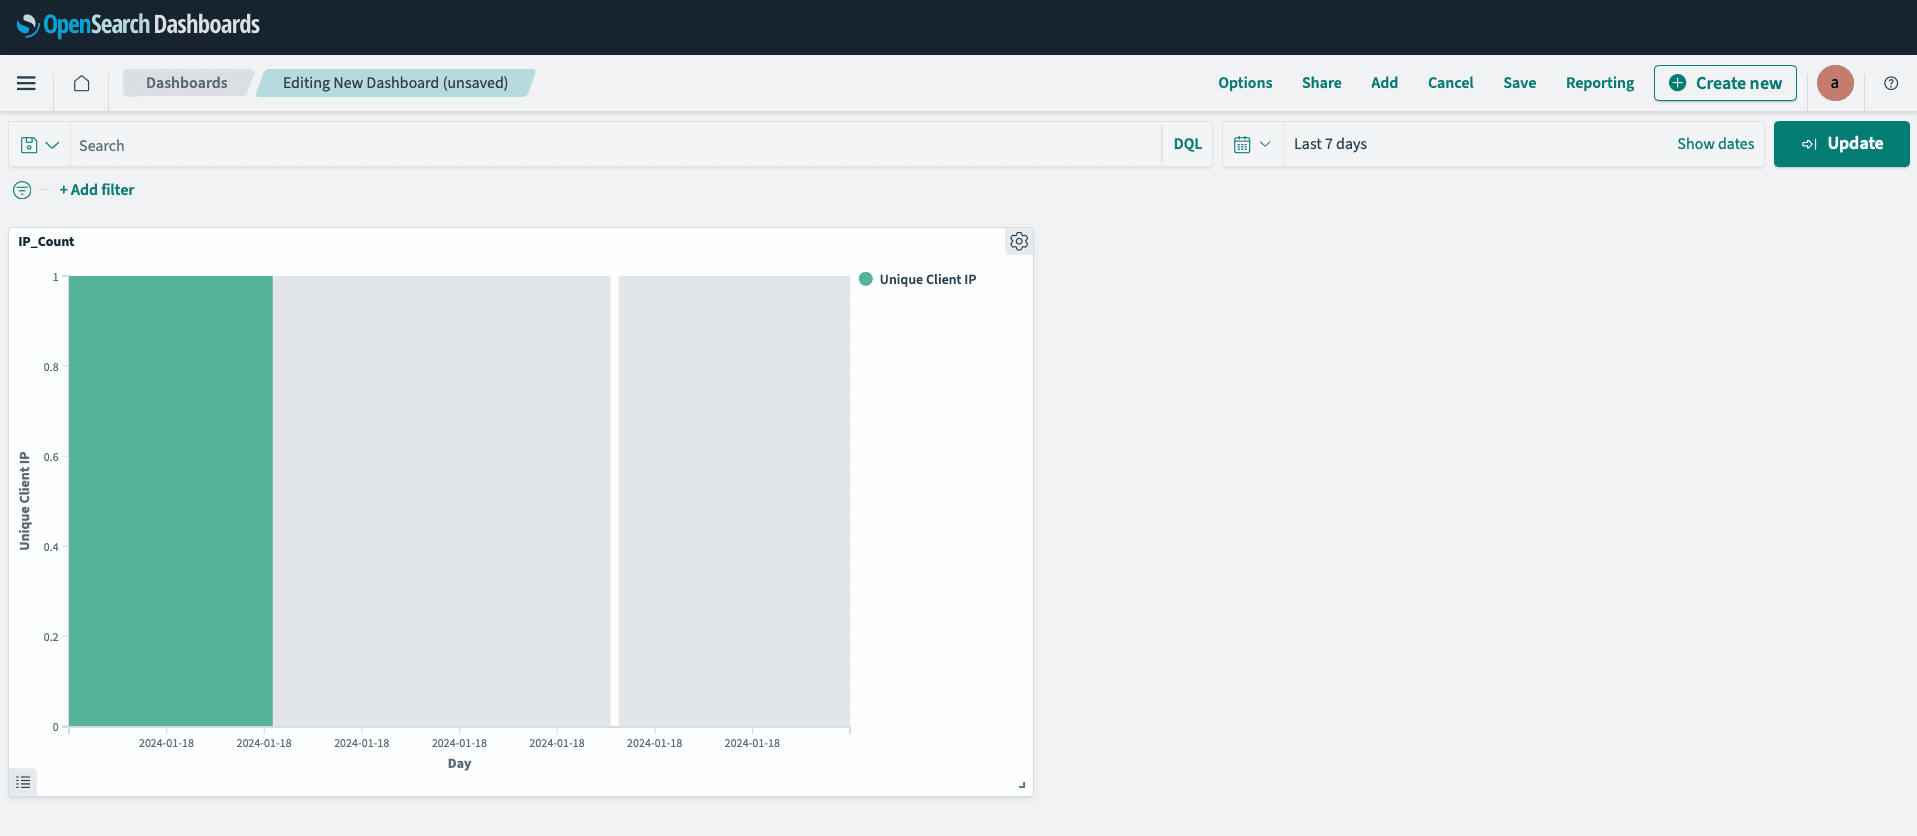
We now have a real-time dashboard showing us the unique IP addresses per day, found in Apache logs.
Step 3: Fluent Bit alternative as the data log source
Multiple agents exist. Fluent Bit is a strong, open-source alternative to Logstash, and works natively with OpenSearch™.
We propose now to parse the Apache access logs and push this information to the OpenSearch™ instance for this agent.

Install Fluent Bit
To install Fluent Bit on our Linux Ubuntu instance, we will install the td-agent-bit package, as described in the Fluent Bit installation process from their official documentation.
Check that the service is running and is enabled to start automatically when the system boots:
Configure Fluent Bit
Let's modify the configuration file /etc/td-agent-bit/td-agent-bit.conf for the INPUT and OUTPUT section :
If required, please refer to the parameters in the Fluent Bit official documentation.
All Apache access logs will now be pushed to the OpenSearch™ instance under the "my-fluent" index.
Step 4: Visualize Fluent Bit data in OpenSearch™ Dashboard
As we did for Logstash, you can create an index pattern to aggregate all the daily data logs stored in OpenSearch™, then visualize those data or create dashboards. In this example, the indices will be my-fluent-YYYY.MM.DD, so you can define a pattern like my-fluent-*.
Congratulations, you are now able to collect data from multiple sources and push them to Cloud Analytics with OpenSearch™!
Go further
OpenSearch™ official documentation
OpenSearch™ Dashboard official documentation
Fluent Bit official documentation
Browse all the Analytics guides.
Browse the rest of the OVHcloud US documentation for guides on our other products and services.
Learn more about Cloud Analytics on the OVHcloud US website.